Opentelemetry로 Kubernetes Observability 확보하기 : Tracing

본 포스팅은 "Opentelemetry오 Kubernetes Observability 확보하기" 시리즈의 3번째 글입니다.
이번 포스팅에서는 애플리케이션의 함수 실행 이력 및 Latency를 측정할 수 있는 Trace에 대한 가시성을 Opentelemetry로 확보하는 방법을 알아보도록 하겠습니다.
Trace 데이터를 관리할 수 있는 도구는 Grafana의 Tempo가 존재합니다. Tempo는 Object storage를 Backend로 사용하기 때문에 비용 효율적이고, 다른 Grafana 도구와의 연계성이 좋다는 장점이 있습니다.
그래서 이번 포스팅에서는 Grafana Tempo를 사용해서 Kubernetes 환경의 Trace 가시성을 확보하는 방법에 대해 알아보도록 하겠습니다.
1. Tempo
1-1. Grafana Tempo란?
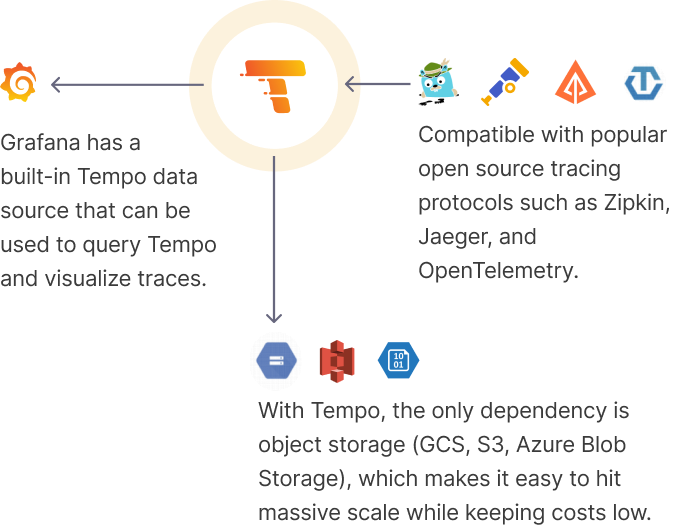
Grafana Tempo는 Grafana Labs에서 출시한 고가용성의 분산 Tracing Backend입니다.
Tempo는 Object Storage에 Trace 데이터를 저장하기 때문에 비용 효율적으로 데이터를 보관할 수 있습니다.
Grafana의 다른 OSS 도구와 호환성이 좋으며 이를 통해 Correlation을 구성하는 것이 수월합니다.
Jaeger, Zipkik과 같은 기존 Trace 프로토콜과 함께 Opentelemetry의 OTLP 프로토콜도 지원하기 때문에 다양한 형식의 데이터에 대응할 수 있습니다.
1-2. Grafana Tempo 설치 및 구성
Grafana Tempo는 Kubernetes 환경에 설치할시 helm을 통해 간편하게 설치할 수 있습니다.
Helm으로 Tempo를 설치하기 전, 먼저 Value 파일을 아래와 같이 구성합니다.
|
1
2
3
4
5
6
7
8
9
10
11
12
13
14
15
16
17
18
19
20
21
22
23
|
global_overrides:
metrics_generator_processors:
- service-graphs
metricsGenerator:
config:
storage:
remote_write:
- send_exemplars: true
url: http://MIMIR_ENDPOINT.svc:80/api/v1/push
enabled: true
storage:
trace:
backend: s3
s3:
bucket: BUCKET_NAME
endpoint: s3.REGION.amazonaws.com
prefix: tempo
traces:
otlp:
grpc:
enabled: true
http:
enabled: true
|
cs |
위 Value 명세는 크게 4가지 섹션으로 나눌 수 있습니다.
첫번째로 global_overrides.metrics_generator_processors 어트리뷰트를 통해 Tempo가 Tracing 데이터와 관련한 Metric을 처리할 수 있습니다.
해당 어트리뷰트에 대해 service-graphs 값을 사용함으로써 Metric을 Service Graph를 그리는데 필요한 데이터로 Processing하도록 합니다.
두번째로 metricsGenerator 어트리뷰트를 통해 Exemplar 데이터를 수집할 수 있습니다.
수집한 Exemplar를 Mimir, Prometheus와 같은 Metrics backend로 전달해 보관하도록 구성합니다.
세번째로 storage 어트리뷰트를 통해 저장할 Backend storage를 구성할 수 있습니다.
사용할 Object storage의 종류와 이에 대한 설정 정보를 기입하는 것으로 Object storage 관련 설정을 구성합니다.
마지막으로 traces 어트리뷰트를 통해 수집할 Trace 데이터의 프로토콜을 지정합니다.
해당 어트리뷰트를 통해 zipkin, jeager, OTLP와 같은 Tracing 프로토콜을 지정할 수 있으며, 본 포스팅에서는 Opentelemetry의 OTLP 프로토콜 데이터를 grpc및 http로 받을 수 있도록 구성합니다.
이제 아래 명령어를 입력해 helm으로 Tempo를 설치할 수 있습니다.
|
1
|
helm upgrade tempo grafana/tempo-distributed -n tempo --values ./tempo-helm-values.yaml --install
|
cs |
아래와 같이 모든 Pod가 동작한다면 Tempo가 정상적으로 설치된 것입니다.
|
1
2
3
4
5
6
7
8
9
10
11
|
$ kubectl get pods -n tempo
NAME READY STATUS RESTARTS AGE
tempo-compactor-7dc86d8d57-kn8qs 1/1 Running 0 2d10h
tempo-distributor-d6d8bcbc6-vtvfq 1/1 Running 0 2d18h
tempo-ingester-0 1/1 Running 0 45d
tempo-ingester-1 1/1 Running 0 45d
tempo-ingester-2 1/1 Running 0 10d
tempo-memcached-0 1/1 Running 0 2d18h
tempo-metrics-generator-6dfdd7d8d8-22dsk 1/1 Running 0 2d18h
tempo-querier-59dc5d9f45-xnlzl 1/1 Running 0 2d18h
tempo-query-frontend-7c646c4b65-t22hg 1/1 Running 0 10d
|
cs |
2. Tracing Architecture
위에서 설치한 Mimir와 OTel Collector를 사용해 Kubernetes 환경에서 Trace 가시성을 확보하는 Tracing Architecture를 구성할 수 있습니다.
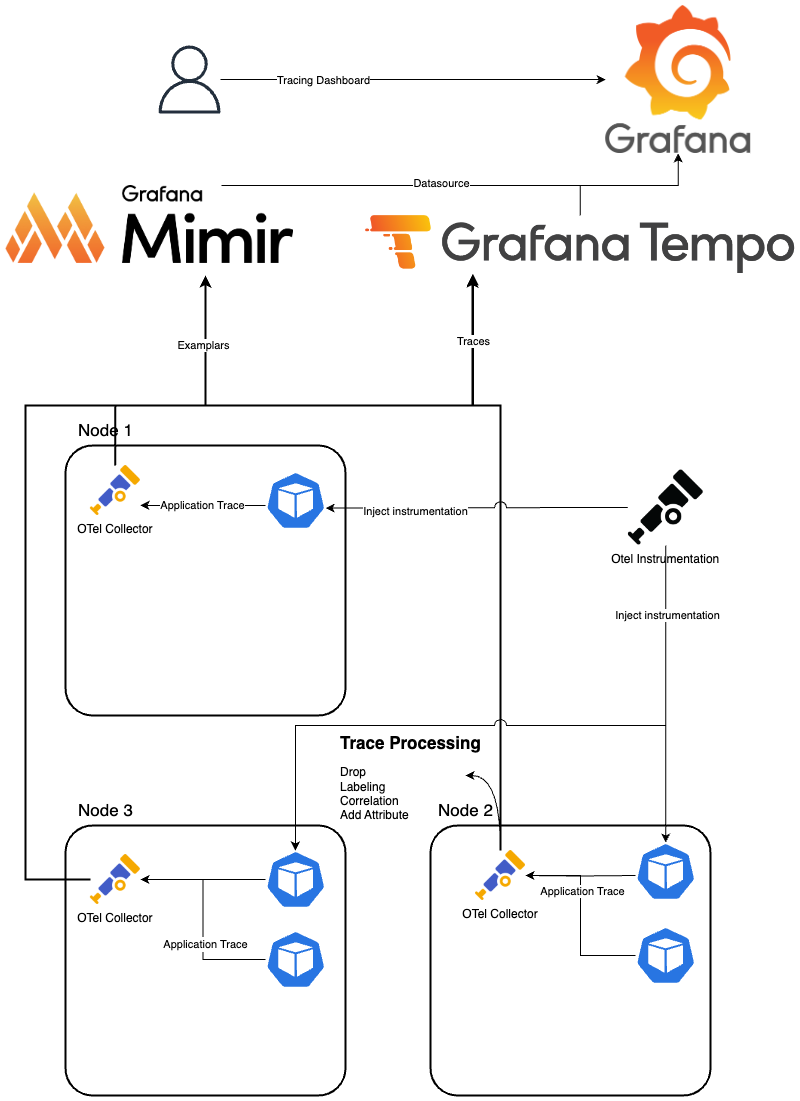
본 구성은 OTel Collector를 이용해서 Trace와 Exemplar를 수집한 뒤, 각각 Grafana Tempo와 Mimir로 전송하는 아키텍처입니다.
Trace는 Application Container에서 수집하기 위해 OTel Instrumentation을 구성해 Instrument가 자동 Inject되도록 설정합니다.
Instrument가 Inject된 Container는 OTLP 프로토콜로 OTel Collector에 Trace와 Exemplar를 전송하며, OTel Collector는 Trace와 Metric Receiver로 데이터를 받아 가공한뒤, Mimir와 Tempo로 전송합니다.
Tempo는 받은 데이터를 압축한 뒤, Object storage backend로 보내 장기간 보관합니다.
이 과정에서 보관된 Trace, Exemplar 데이터는 Grafana 대시보드에서 시각화해 확인할 수 있습니다.
위 내용을 아래와 같이 테이블로 정리할 수 있습니다.
| Component | Role | Deploy |
| OTel Collector (Trace Receiver) | Collect Trace | Daemonset or Deployment |
| OTel Collector (Metric Receiver) | Collect Exemplar | Daemonset or Deployment |
| OTel Instrumentation | Inject Instrument | CR (Custom Resource) |
3. Opentelemetry Configuration
이제 위 아키텍처를 구현하기 위해 필요한 OTel 설정 및 구성에 대해 알아보도록 하겠습니다.
3-1. Opentelemetry Collector
먼저 OTel Collector 설정을 보겠습니다.
OTel Collector는 Application으로부터 전송되는 Trace, Exemplar 데이터를 받아 가공한 뒤, Backend Mimir, Tempo로 전달하는 역할을 합니다.
Overall Configuration
|
1
2
3
4
5
6
7
8
9
10
11
12
13
14
15
16
17
18
19
20
21
22
23
24
25
26
27
28
29
30
31
32
33
34
35
|
exporters:
prometheusremotewrite:
endpoint: "http://mimir-nginx.mimir.svc:80/api/v1/push"
otlp:
endpoint: tempo-distributor-discovery.tempo:4317
tls:
insecure: true
batch: {}
memory_limiter:
check_interval: 5s
limit_percentage: 80
spike_limit_percentage: 25
receivers:
otlp:
protocols:
http:
grpc:
service:
pipelines:
traces:
exporters:
- otlp
processors:
- memory_limiter
- batch
receivers:
- otlp
metrics:
exporters:
- prometheusremotewrite
processors:
- memory_limiter
- batch
receivers:
- otlp
|
cs |
Opentelemetry Collector에 사용할 Configuration의 전체 설정입니다.
이 설정을 섹션별로 나누어서 살펴보도록 하겠습니다.
Receiver Configuration
|
1
2
3
4
5
6
7
|
exporters:
prometheusremotewrite:
endpoint: "http://mimir-nginx.mimir.svc:80/api/v1/push"
otlp:
endpoint: tempo-distributor-discovery.tempo:4317
tls:
insecure: true
|
cs |
Receiver는 otlp 프로토콜을 사용해 Trace와 Exemplar를 수집할 수 있는 "otlp"를 사용합니다.
OTel Collector가 http와 grpc 프로토콜을 사용해 데이터를 수집할 수 있도록 구성 가능합니다.
Processor Configuration
|
1
2
3
4
5
6
|
processors:
batch: {}
memory_limiter:
check_interval: 5s
limit_percentage: 80
spike_limit_percentage: 25
|
cs |
Processor는 별도의 Labeling이나 Drop같은 가공이 필요하지 않다면 "batch"와 "memory_limiter"을 사용할 수 있습니다.
Exporter Configuration
|
1
2
3
4
5
6
7
|
exporters:
prometheusremotewrite:
endpoint: "http://mimir-nginx.mimir.svc:80/api/v1/push"
otlp:
endpoint: tempo-distributor-discovery.tempo:4317
tls:
insecure: true
|
cs |
Exporter는 Trace를 전달하기 위한 “otlp”와 Exemplar를 전달하기 위한 ”prometheusremotewrite”를 사용합니다.
각 Exporter의 endpoint 어트리뷰트에 Mimir와 Tempo의 데이터 진입점을 입력해 구성합니다.
Pipeline Configuration
|
1
2
3
4
5
6
7
8
9
10
11
12
13
14
15
16
17
18
|
service:
pipelines:
traces:
exporters:
- otlp
processors:
- memory_limiter
- batch
receivers:
- otlp
metrics:
exporters:
- prometheusremotewrite
processors:
- memory_limiter
- batch
receivers:
- otlp
|
cs |
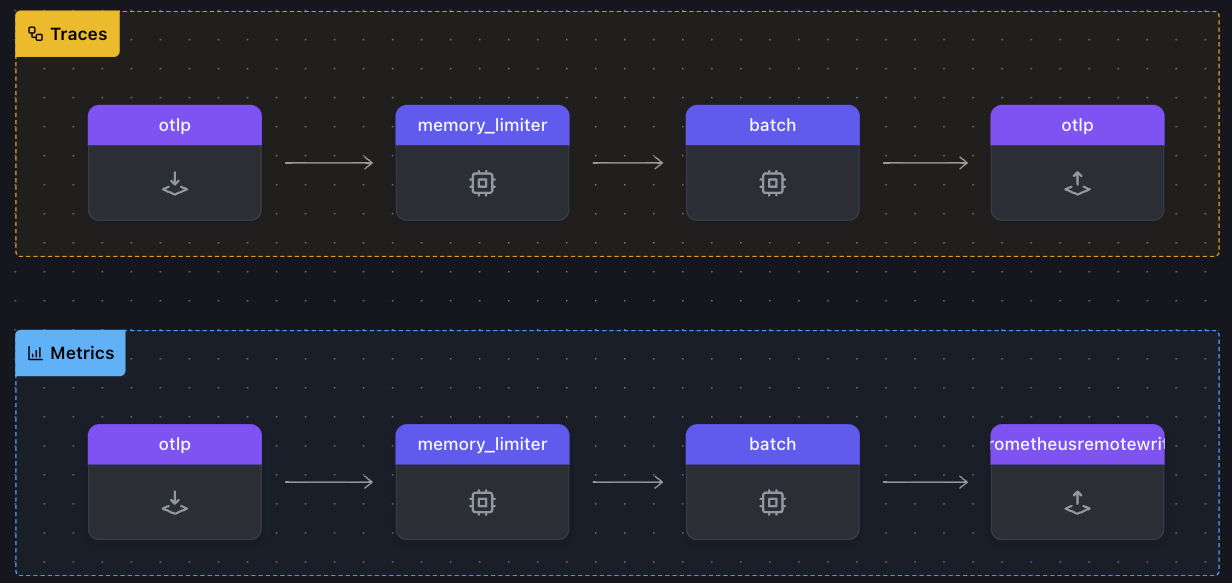
마지막으로 위에서 정의한 Receiver, Processor, Exporter를 순서에 맞게 조합하는 Pipeline을 정의합니다.
위 Pipeline을 시각화하면 아래와 같이 표현할 수 있습니다.
3-1. Opentelemetry Instrumentation
Application에 Instrument를 자동으로 Inject하는 Instrumentation 설정에 대해 알아보겠습니다.
Overall Configuration
|
1
2
3
4
5
6
7
8
9
10
11
12
13
14
15
16
17
18
19
20
21
22
23
24
25
26
27
28
29
30
31
32
33
34
35
36
37
38
39
40
41
42
43
44
45
46
47
48
49
50
51
52
53
54
55
56
57
58
59
60
61
62
63
64
65
66
67
68
69
70
71
72
73
74
75
76
77
78
79
80
81
82
83
84
|
apiVersion: opentelemetry.io/v1alpha1
kind: Instrumentation
metadata:
name: demo-instrumentation
namespace: otel
spec:
apacheHttpd:
configPath: /usr/local/apache2/conf
image: ghcr.io/open-telemetry/opentelemetry-operator/autoinstrumentation-apache-httpd:1.0.4
resourceRequirements:
limits:
cpu: 500m
memory: 128Mi
requests:
cpu: 1m
memory: 128Mi
version: "2.4"
dotnet:
image: ghcr.io/open-telemetry/opentelemetry-operator/autoinstrumentation-dotnet:1.2.0
resourceRequirements:
limits:
cpu: 500m
memory: 128Mi
requests:
cpu: 50m
memory: 128Mi
exporter:
endpoint: http://demo-collector.otel.svc.cluster.local:4317
go:
env:
- name: OTEL_EXPORTER_OTLP_ENDPOINT
value: http://demo-collector.otel.svc.cluster.local:4318
image: ghcr.io/open-telemetry/opentelemetry-operator/autoinstrumentation-dotnet:1.2.0
resourceRequirements:
limits:
cpu: 500m
memory: 32Mi
requests:
cpu: 50m
memory: 32Mi
java:
image: ghcr.io/open-telemetry/opentelemetry-operator/autoinstrumentation-java:1.32.1
resources:
limits:
cpu: 500m
memory: 64Mi
requests:
cpu: 50m
memory: 64Mi
nginx:
configFile: /etc/nginx/nginx.conf
image: ghcr.io/open-telemetry/opentelemetry-operator/autoinstrumentation-apache-httpd:1.0.4
resourceRequirements:
limits:
cpu: 500m
memory: 128Mi
requests:
cpu: 1m
memory: 128Mi
nodejs:
image: ghcr.io/open-telemetry/opentelemetry-operator/autoinstrumentation-nodejs:0.46.0
resourceRequirements:
limits:
cpu: 500m
memory: 128Mi
requests:
cpu: 50m
memory: 128Mi
propagators:
- tracecontext
- baggage
python:
image: ghcr.io/open-telemetry/opentelemetry-operator/autoinstrumentation-python:0.43b0
resourceRequirements:
limits:
cpu: 500m
memory: 32Mi
requests:
cpu: 50m
memory: 32Mi
resource: {}
sampler:
argument: "1"
type: parentbased_traceidratio
|
cs |
위 Instrumentation CR을 통해 go, java, nodejs.. 등의 언어로 쓰여진 Application에 Instrument를 자동 주입할 수 있습니다.
Instrument를 원하는 오브젝트는 다음과 같이 spec.template.metadata.annotations 어트리뷰트에 Inject 값을 설정합니다.
|
1
2
3
4
5
6
7
8
9
10
11
12
13
14
15
16
17
18
19
20
21
22
23
24
|
apiVersion: apps/v1
kind: Deployment
metadata:
name: bifrost
spec:
progressDeadlineSeconds: 600
replicas: 1
revisionHistoryLimit: 10
selector:
matchLabels:
app: bifrost
strategy:
rollingUpdate:
maxSurge: 25%
maxUnavailable: 25%
type: RollingUpdate
template:
metadata:
annotations:
instrumentation.opentelemetry.io/inject-java: otel/demo-instrumentation
## metadata.annotations가 아닌 spec.template.metadata.annotations임에 주의
labels:
app: bifrost
spec:
|
cs |
4. 마무리
Grafana Tempo는 Grafana에서 출시한 Distributed Trace Backend입니다.
Tempo를 사용하여 Trace 데이터를 Object Storage에 비용 효율적으로 저장할 수 있으며, Opentelemetry와의 연계를 통해 Trace 및 Exemplar를 손쉽게 수집 및 저장할 수 있습니다.
이렇게 Metric, Log, Trace의 Three Pilars of Observability라고 부르는 3개 Telemetry 데이터를 모두 다뤄봤는데요.
다음 포스팅에서는 Correlation을 통해 위의 3개 데이터를 연관지어 분석하는 방법에 대해 알아보도록 하겠습니다.